
Progress Charts
Track to-do lists on a progress chart to show whether each piece of work is still being figured out or being finished, with a history of every update.
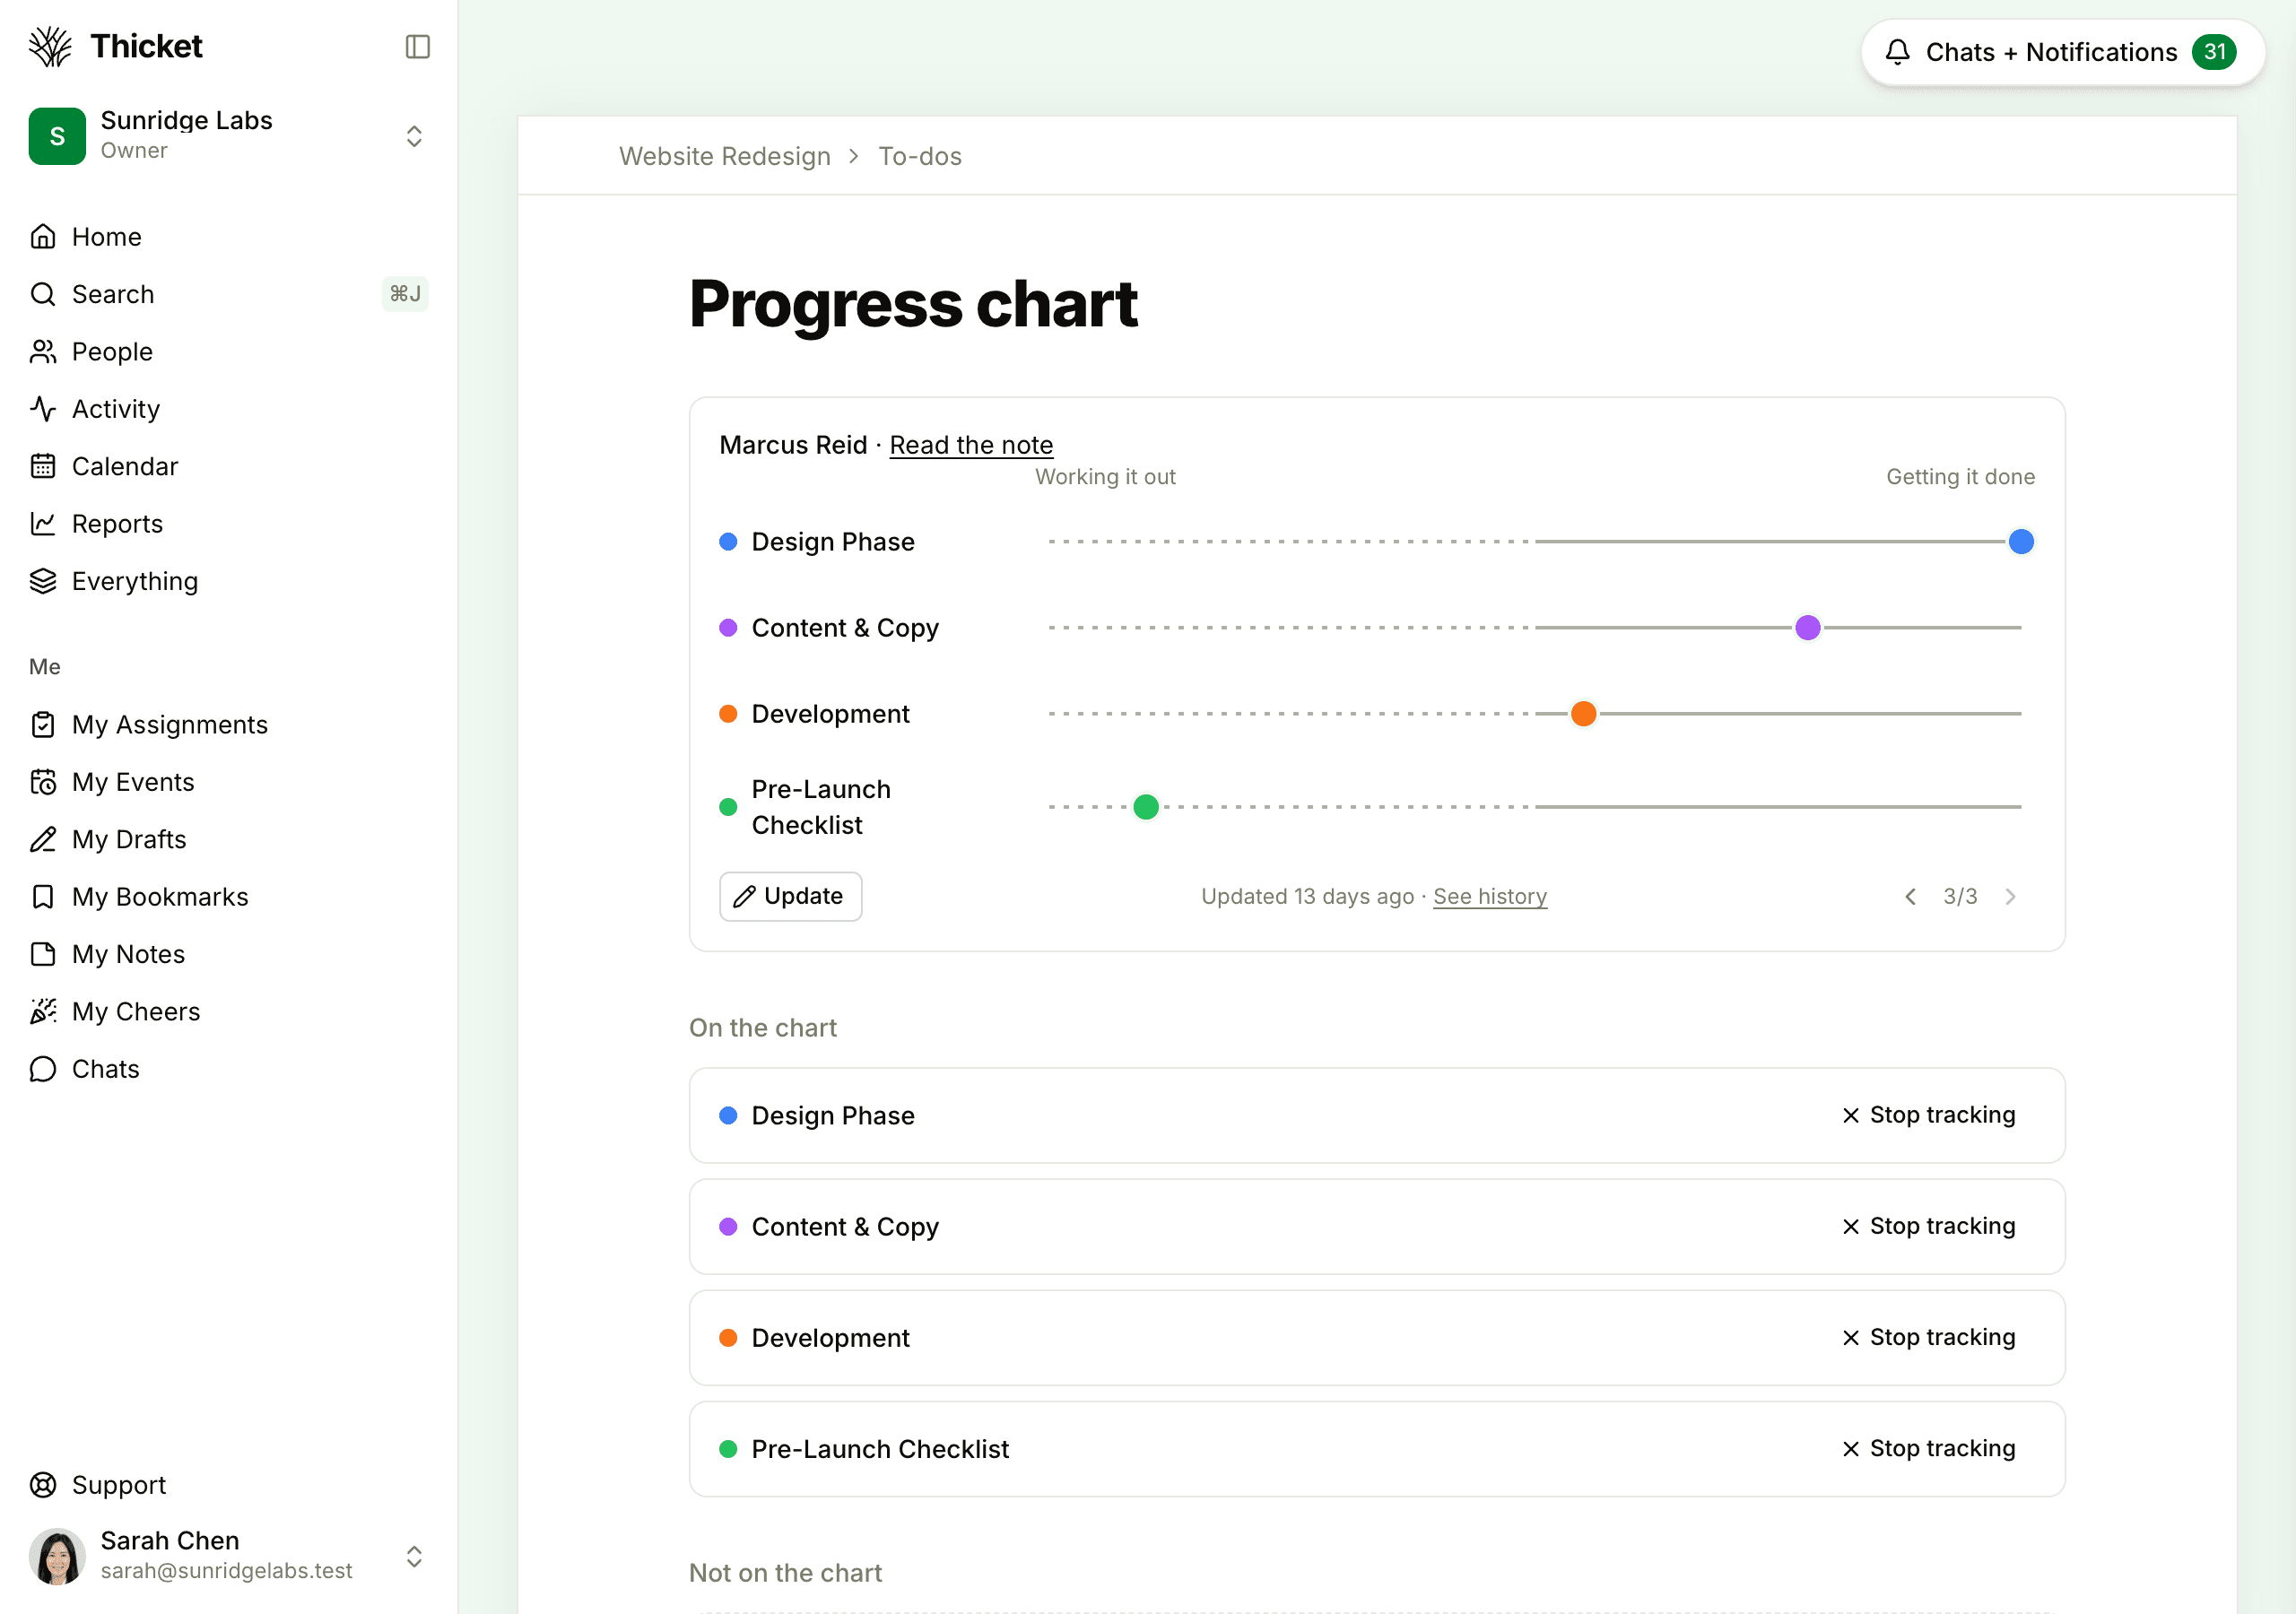
A to-do list's checkboxes tell you how many items are done, but not whether the hard part is behind you. A progress chart shows that. Each list you track is a colored dot on a line with two halves:
- The dotted left half, Working it out, is for work where the approach is still being figured out
- The solid right half, Getting it done, is for work where the approach is settled and what's left is doing it
The far left means not started and the far right means done. The middle means the approach is understood, not that half the work is finished.
Dots don't move on their own. Someone on the team moves them when they post an update, and each update is saved, so you can see how the work moved over time.
Where to find the chart
Each project has one progress chart, in its To-dos tool:
- Once a list is tracked, the chart appears at the top of the project's To-dos page and on the To-dos card of the project's home page. Click it to open the full chart.
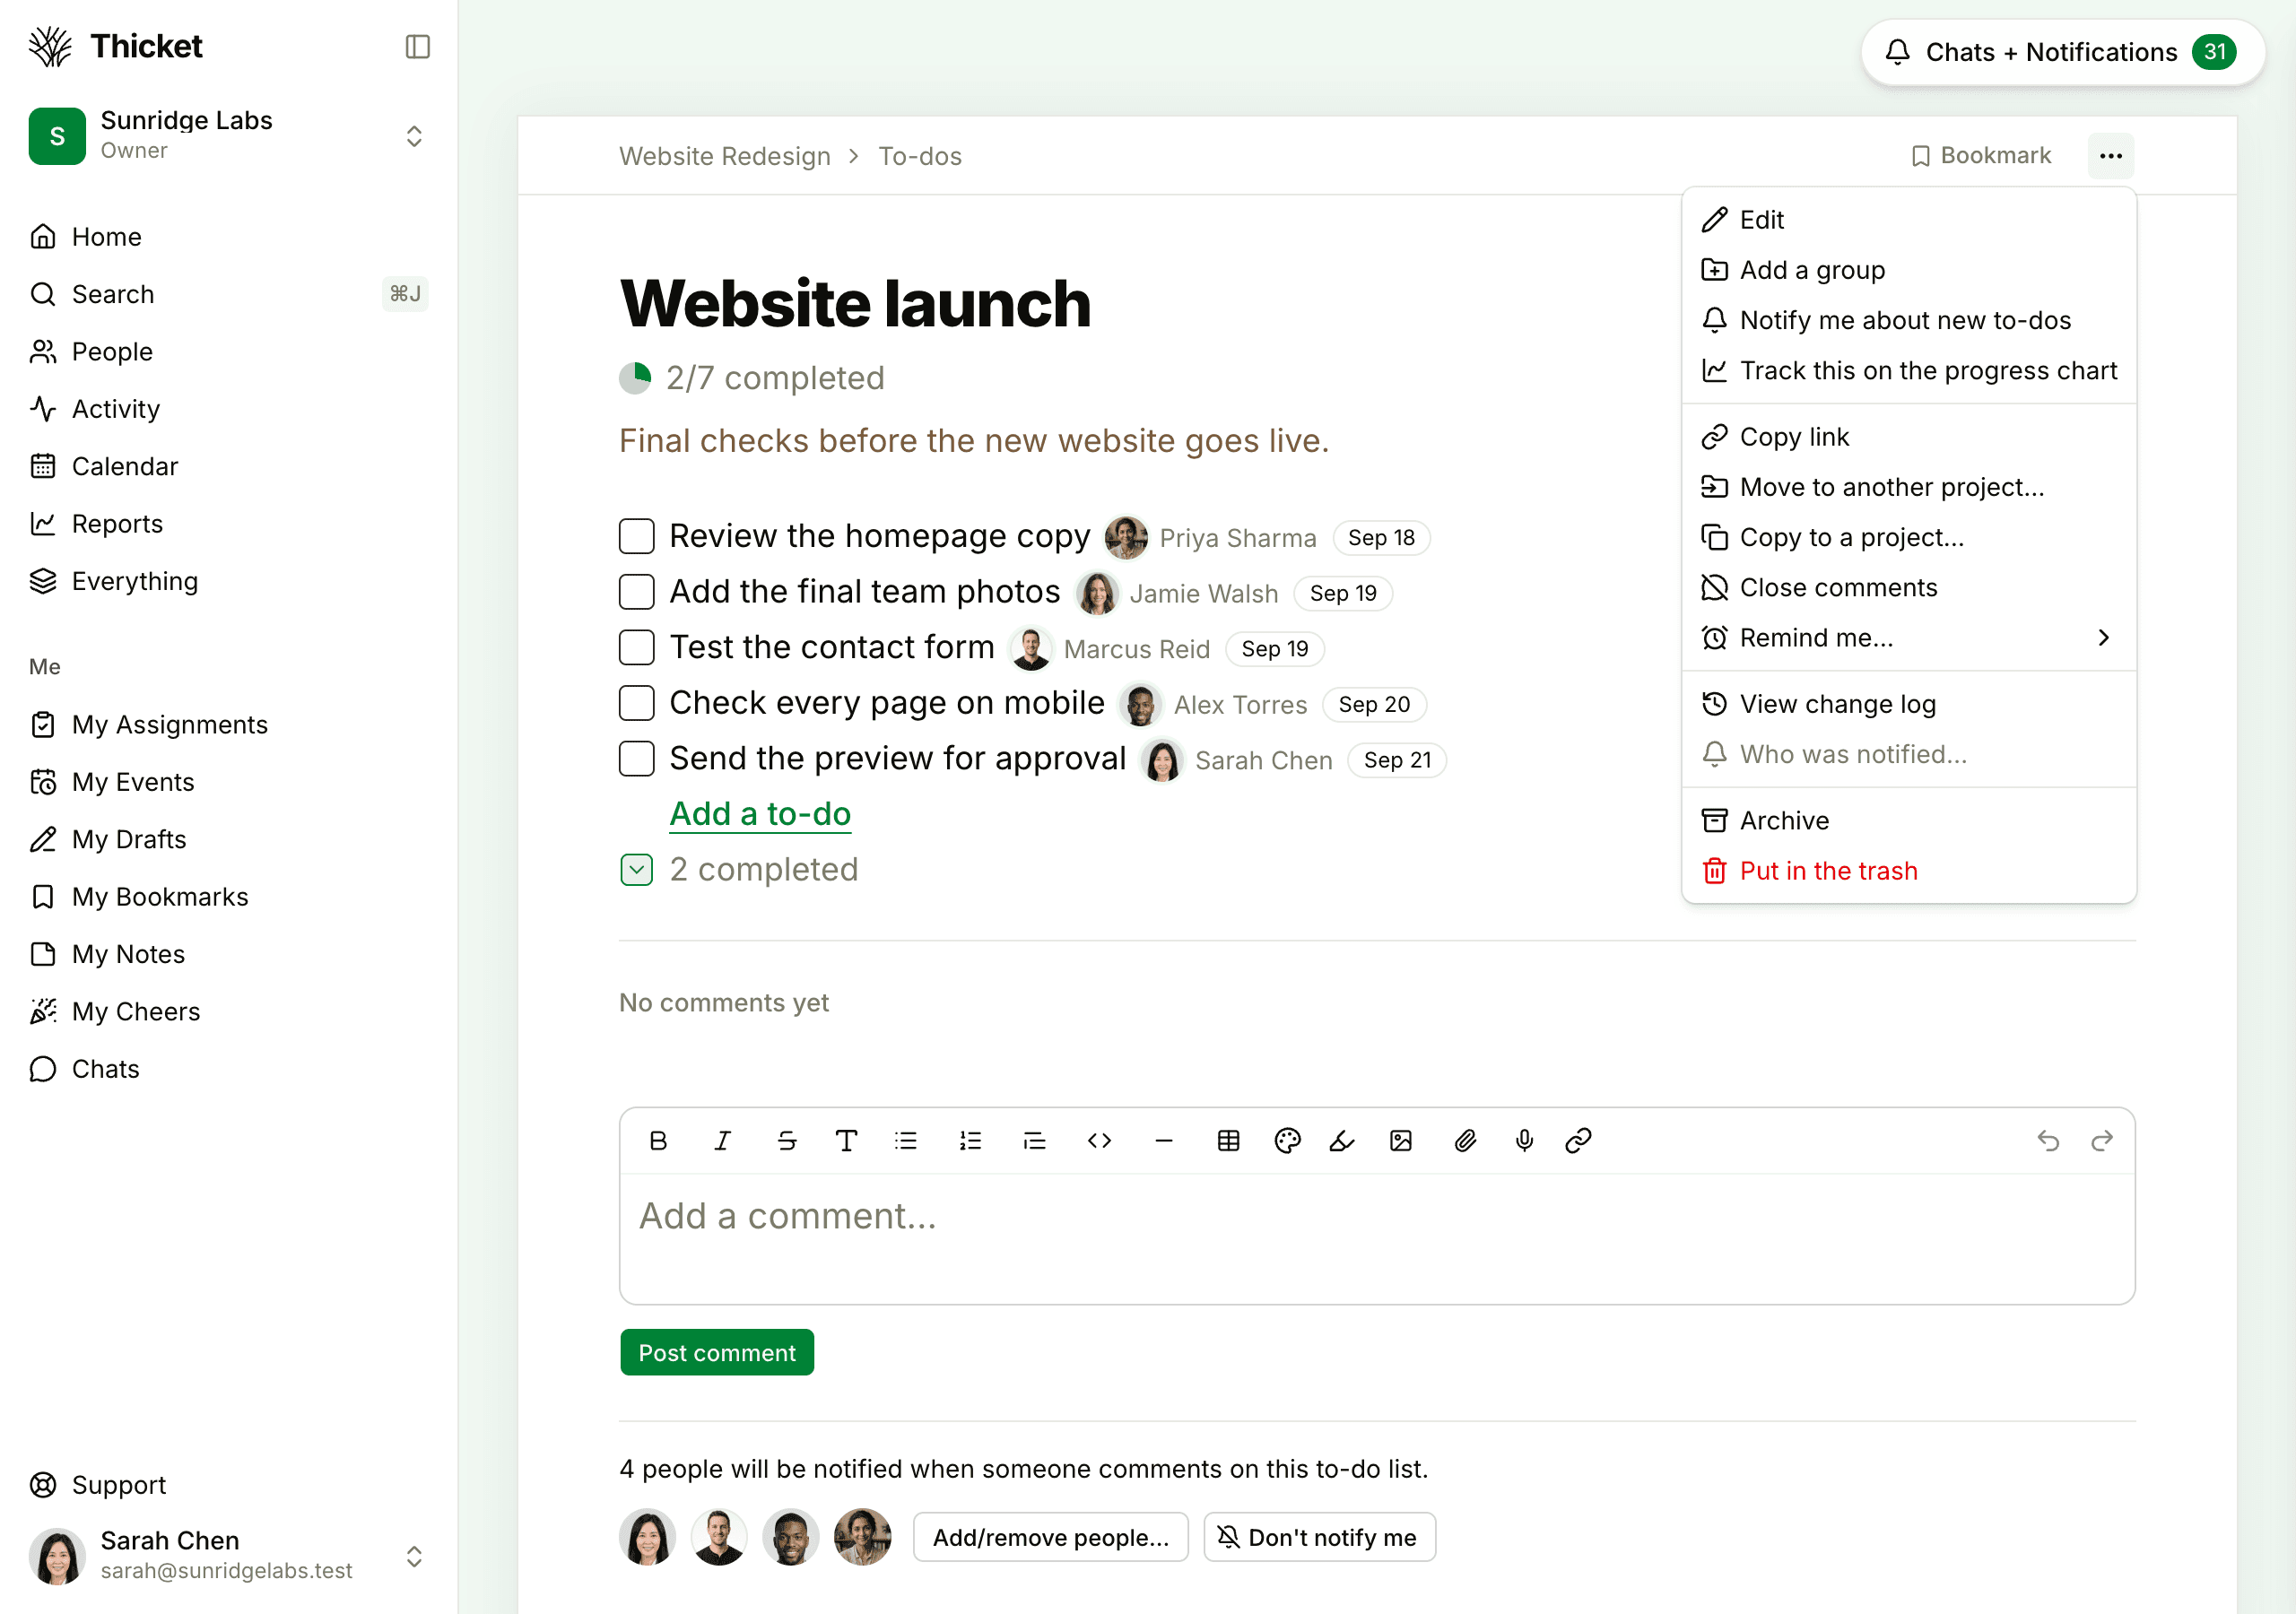
- From the ••• menu at the top of the To-dos page, choose Progress chart.
- A tracked list's own page shows its dot, and a dot in the list's color next to its name.
Tracking a list
- Open the to-do list
- Click ••• at the top right
- Choose Track this on the progress chart
Or, on the progress chart page, find the list under Not on the chart and click Add to the chart. A newly tracked list starts at the far left, and each list keeps its own color.
You can track top-level lists, not the groups inside a list. To take a list off the chart, choose Don't track on the progress chart from the list's ••• menu, or click Stop tracking next to it on the progress chart page.
Updating the chart
- On the progress chart page, click Update
- Drag each dot to where that list stands. You can also click a dot and move it with the arrow keys
- Add a Note about what changed, if you like
- If the project works with clients, choose whether to Share this update with clients. It's ticked to start
- Under When this posts, notify…, choose Everyone on this project, Only the people I pick…, or No one
- Click Save this update
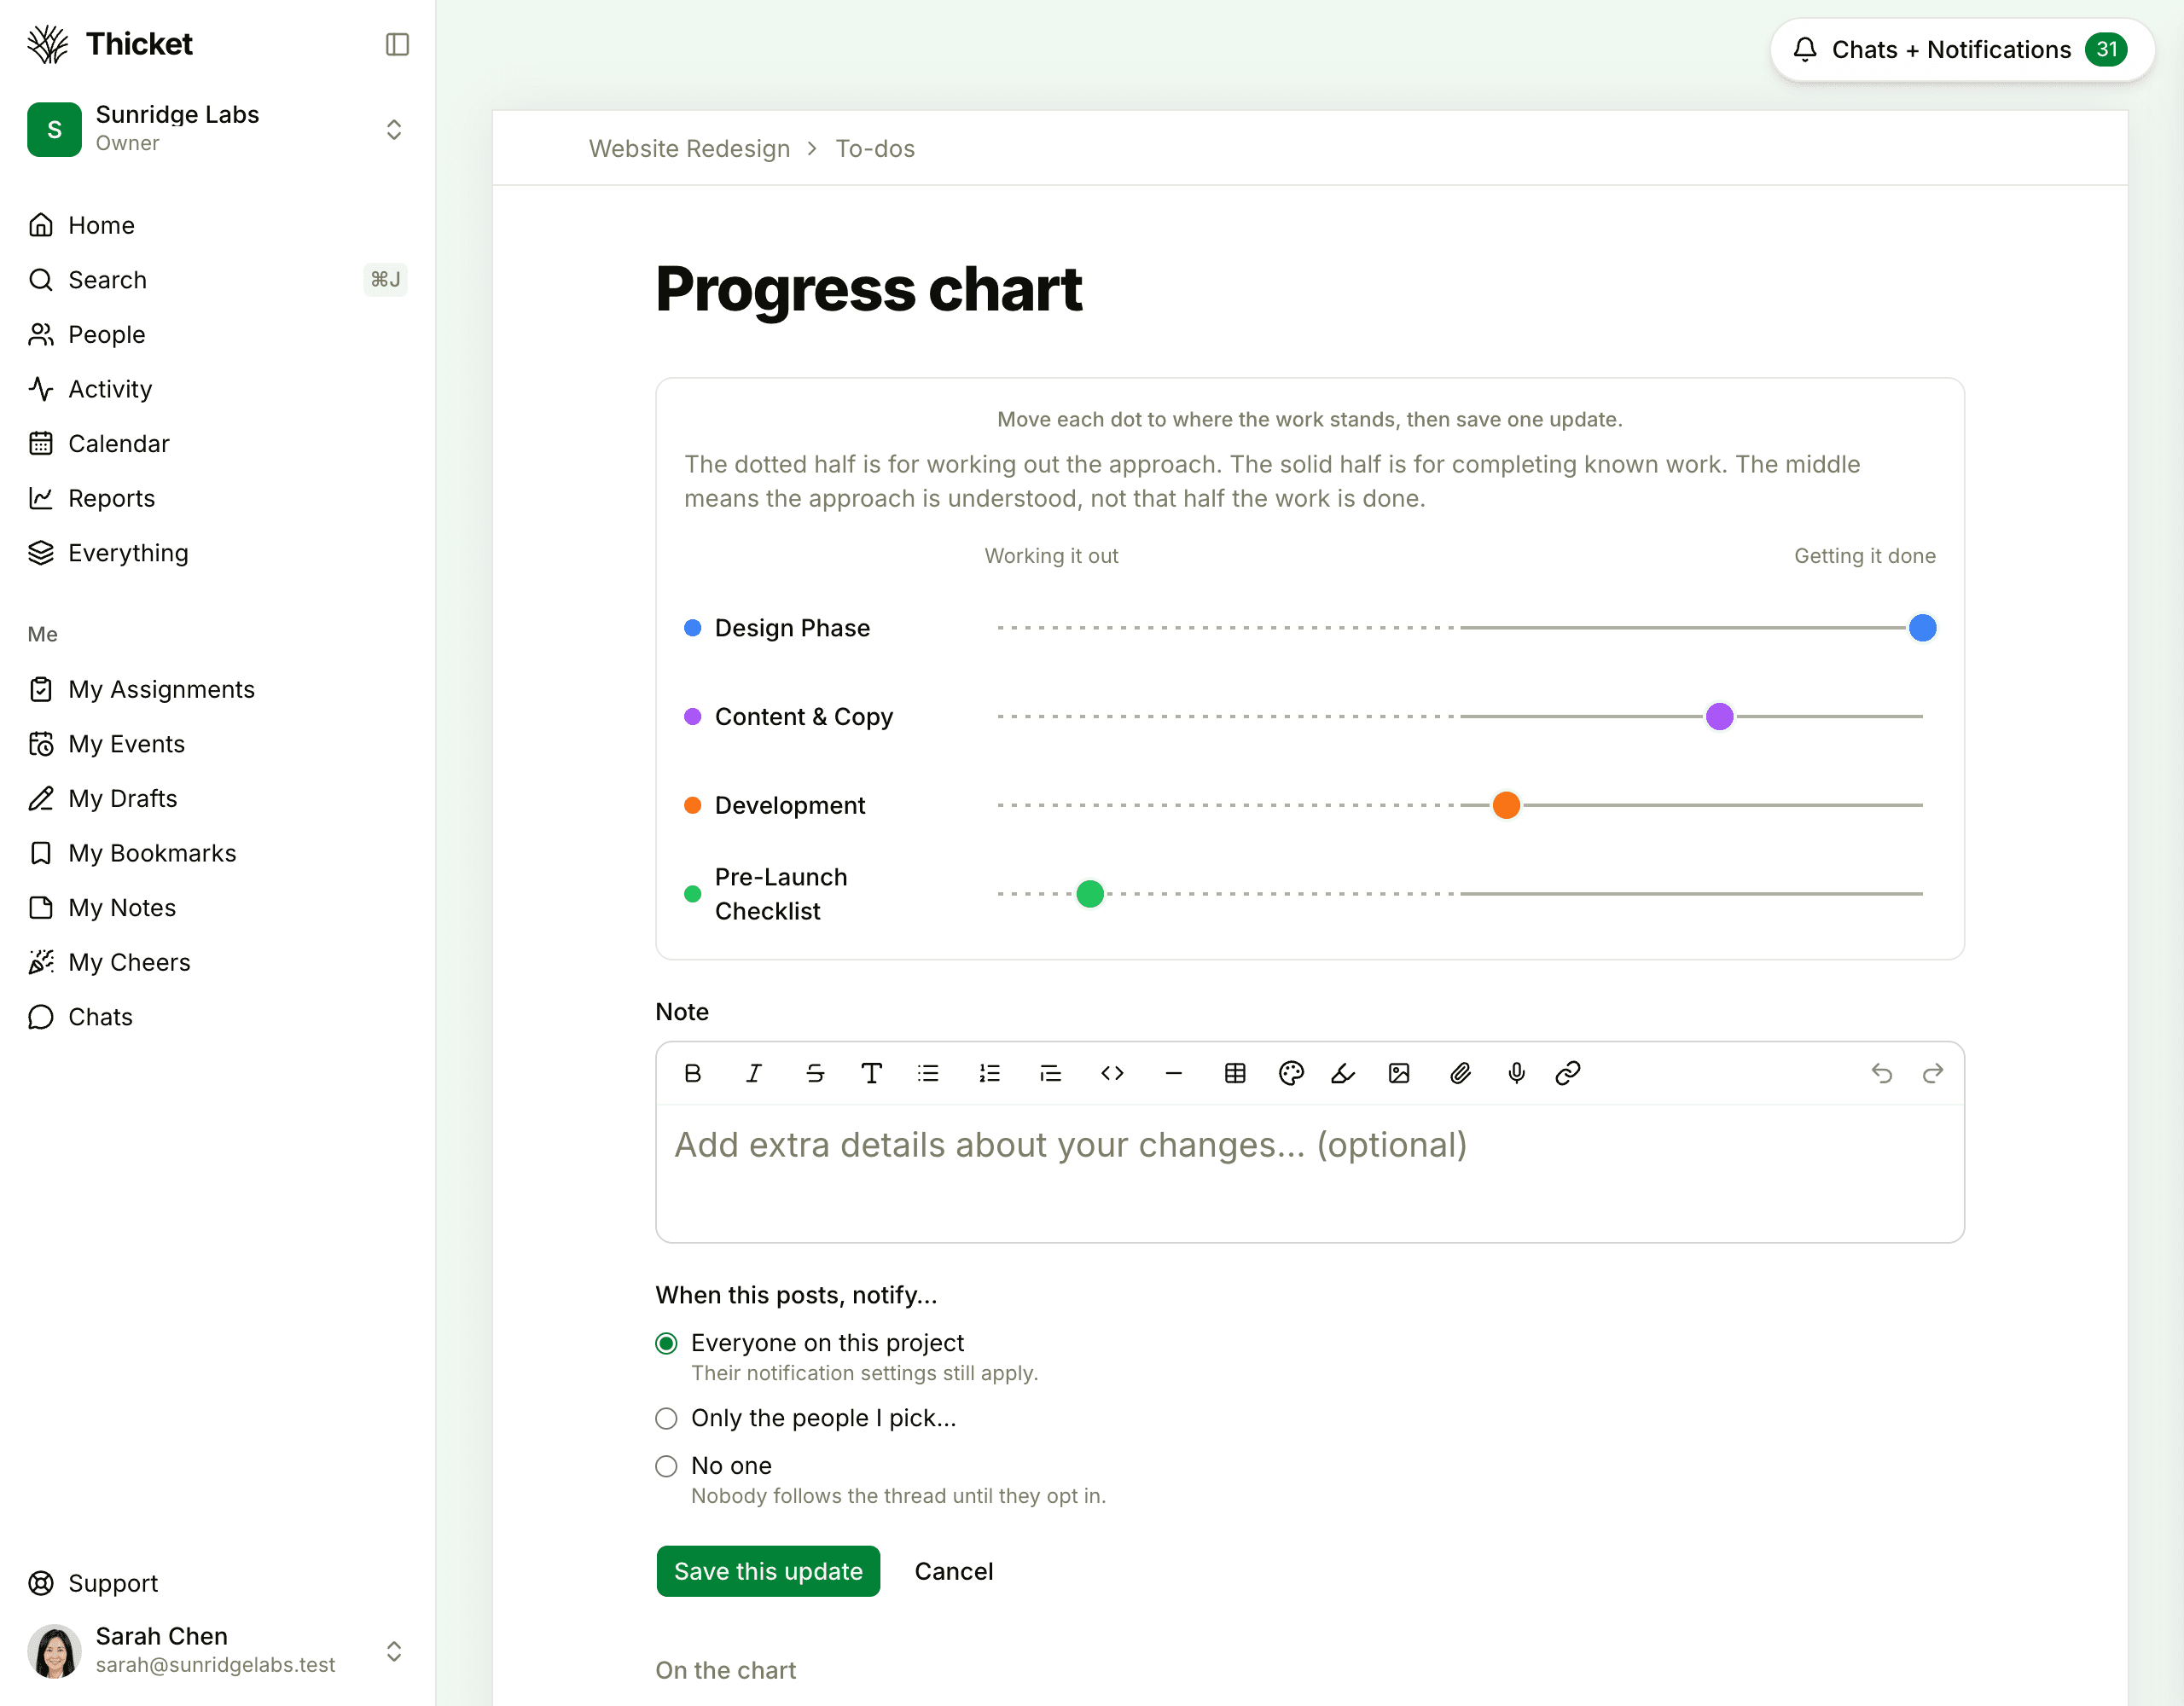
Every dot you move goes into one saved update.
History
Each saved update is kept under History at the bottom of the progress chart page, newest first: who posted it and when, the chart as it stood, and the note. If the project has project health turned on, each entry also shows the project's health status at the time. Click Discuss to comment on an update.
The arrows at the bottom right of the chart step back through the saved updates, and See history jumps down to the list. If an update is put in the trash, the dots go back to where the update before it left them.
Renaming the two halves
You can rename Working it out and Getting it done for each project. Open Chart labels near the bottom of the progress chart page, type new names for the Dotted half and the Solid half (up to 32 characters each), and click Save labels. To go back to the original names, click Use defaults, then Save labels.
Who can do what
- Anyone on the team with access to the project can track lists, post updates, and rename the halves.
- Clients see the chart only for lists shared with them, and only the updates shared with them. They can't track lists or post updates.
Charts across projects
Reports > Progress overview shows the progress chart of every project that has had an update in the last 90 days, most recently updated first. Click a chart to open it. The overview is for your team; clients can't open it. See Reports.